Iron ore loadings are gaining momentum as they approach their seasonal climax in Jul’25

Seasonality is back in play, unlocking a virtuous cycle for shipowners: rising seaborne volumes and falling prices, with iron ore benchmark price testing 95 $/t CFR China – a setup that could encourage restocking.

Detailed line chart showing weekly global iron ore loadings from January to early June for the years 2023, 2024, and 2025. The chart highlights a seasonal increase in 2025, with a weekly volume of 39.3 Mt recorded on 1 June. Year-on-year growth reaches +9%, and the data includes minimum and maximum values over a five-year range. The chart is designed in IFCHOR GALBRAITHS brand colours and includes a clear visual comparison across years.

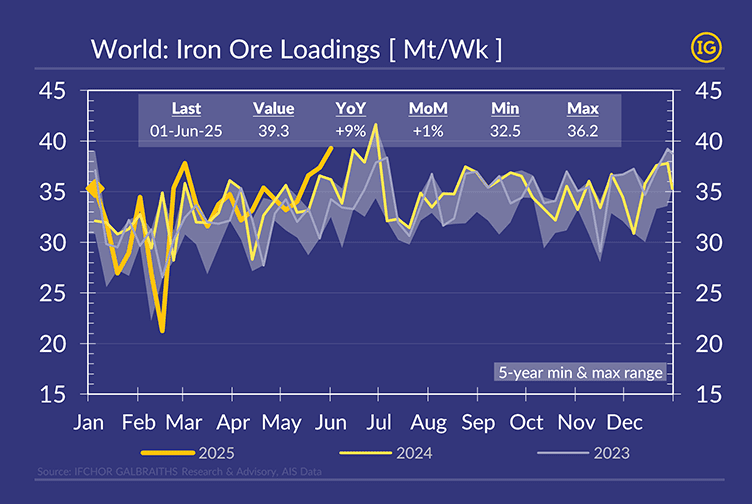
Last week saw another seasonal record in weekly iron ore loadings. The momentum has shifted from Australia to the Atlantic basin, with a sharp- albeit possibly short-lived – rise in shipments from Brazil, Canada, and South Africa. This strength offset a steep drop in India’s exports, now below 1 Mt/week, a 5-year seasonal low due to monsoon disruptions and price-sensitive exporters.

For further insights, contact: [email protected].