Global iron ore supply response following cyclones Sean & Zelia in Australia

Pendulum swing? Global iron ore loadings hit 39Mt/Wk last week – just 3Mt/Wk below record – as Australian miners…

Line chart showing India Iron Ore Loadings in Million Tonnes per Week, with IFCHOR GALBRAITHS brand colors. Data spans from January 2023 to March 2025, showing historical and projected values. Key data points include the last value (1.6 Mt/Wk), year-over-year change (+11%), month-over-month change (+48%), and 5-year minimum and maximum range. The chart uses two lines to represent 2023 and 2024, with a shaded area indicating the 5-year range.

… cleared a backlog of ships delayed by 2 recent cyclones near Port Hedland.

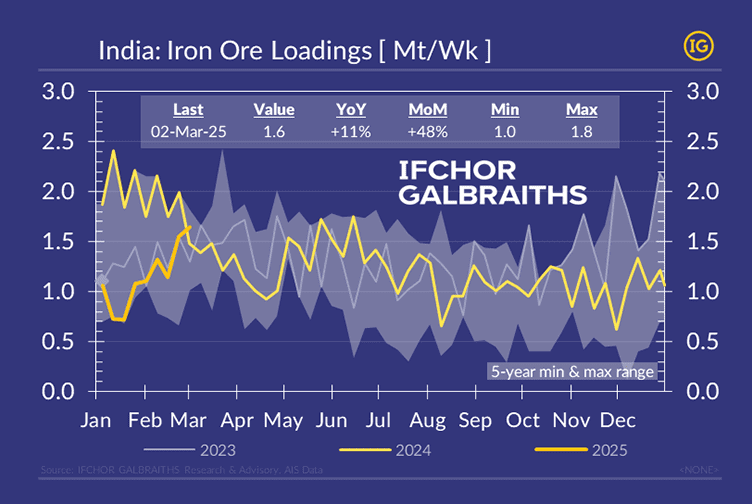
Meanwhile, Asian steel mills, fearing prolonged disruptions, secured replacement cargoes from South Africa or India. After a quiet post-monsoon period, Indian exports surged to 1.6Mt/Wk in late February, marking the first YoY increase in 5 months.

Is this a short-term swing or the start of a broader shift? Let’s discuss. For further insights, contact: [email protected].