Dunkelflaute in China in November? Plateauing wind output sent Coal imports and mining to record!

Dunkelflaute in China? Despite wind hitting a record 82.4TWh in Nov’24, driven by…

China wind power output chart in IG colours, with three lines representing 2022, 2023, and 2024 trends. The x-axis shows months from January to December, and the y-axis measures output in TWh, ranging from 20 to 120. November 2024 output reached 82.4 TWh, marking a 3% year-on-year increase. A shaded area represents the 5-year minimum and maximum range, with the 2024 line peaking in February and November.

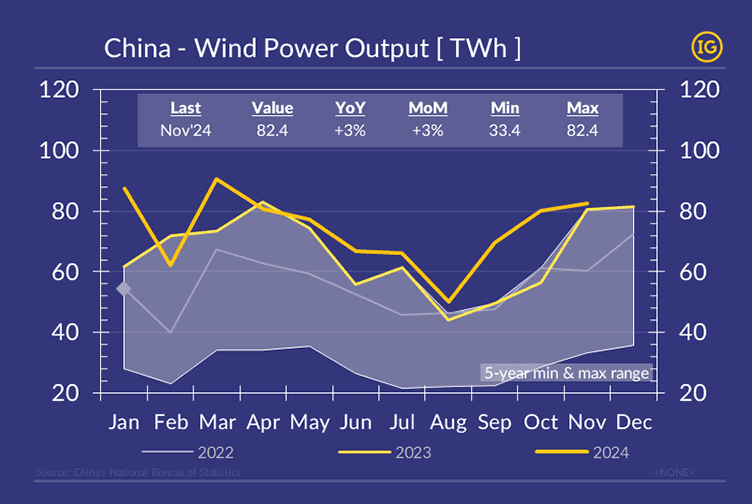
… a +16% YoY surge in installed capacity, the output rose just +2.5% YoY – slower than the +41% YoY in Sep/Oct. This allowed thermal power to bridge the gap with demand, by adding +10TWh YoY to a new seasonal high of 518TWh/mth. With constrained hydro & wind power output in sight, Chinese authorities let both coal imports (+26% YoY to 55Mt) and domestic mining (+3.4% YoY to 428Mt) rise to new records in November.

For more insights on this topic and its impact on the freight market, contact us at [email protected].